Module Evaluation Feedback can be done online, this saves a lot of hours of work collating questionnaire answers and saves paper.
If you are concerned that students will not fill in the questionnaire if it is online, then allow a little time in the lecture as you would with a paper questionnaire, and students can fill it in during class time using their mobile devices. On the rare occasion a student does not have a mobile device, ask them to fill it in at home, (or log into a computer if one is available) you can also ask any non-attendees to fill it in at home.
For maximum response, it is advised to not wait until the very end of the final class when they will be leaving the room straight afterwards, as often students will not fill it in, but are more likely to if you make time during or before the final class.
- Setting up a standard Moodle evaluation template
- Viewing the results of the standard template evaluation
- Admin only - merge module reports
Setting up a standard Moodle evaluation template
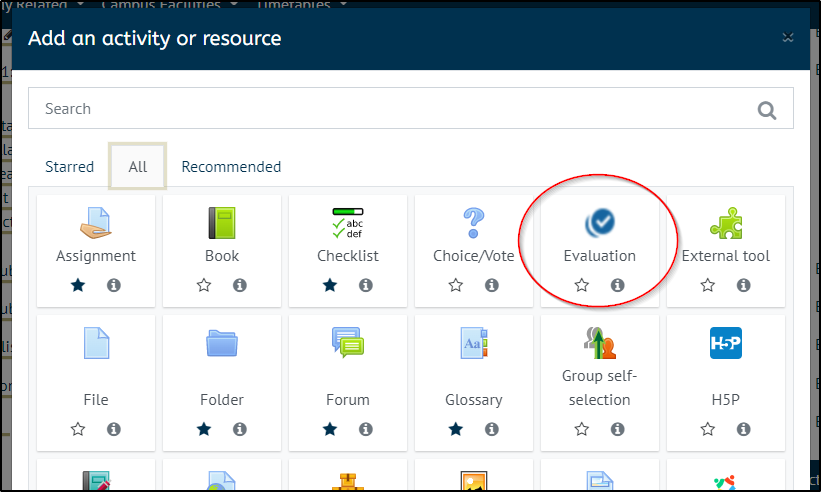
With editing turned on. click add an activity or resource and choose Evaluation
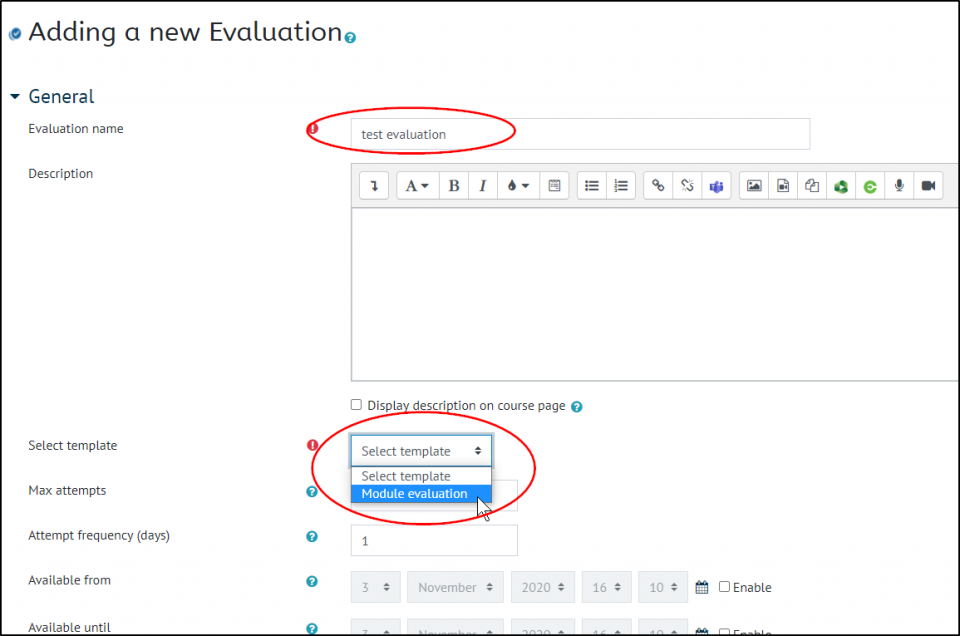
- Give your evaluation a name
- in the select template drop down set it to Module evaluation
Then scroll to the bottom and click save and return to course.
You can click on the evaluation to preview the questions or view the results. (please note the results option is not available until the evaluation has a response)
Below is a word document with the questions in a text format, and also screenshots of how the questionnaire looks to the student on the moodle page.
Screenshots from Moodle:
Questions 1 - 5
questions 6 - 12
Questions 13 - 19
Viewing the results of the standard template evaluation
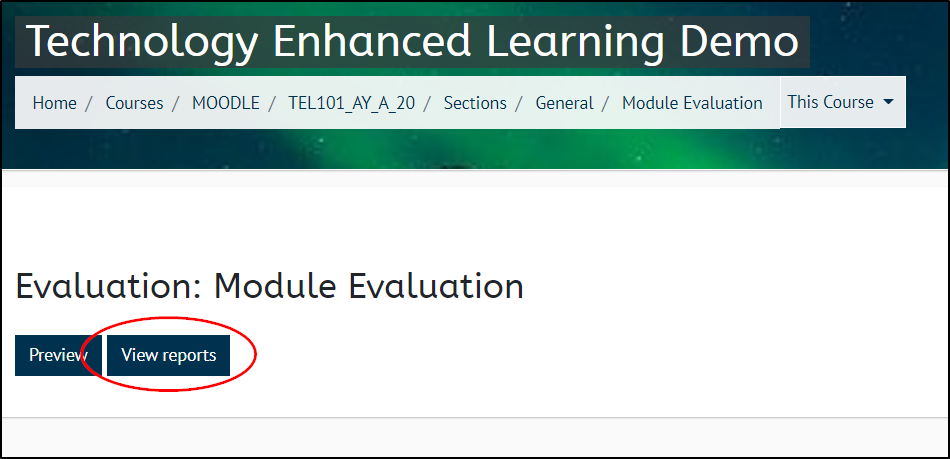
To view the results, click on your Module evaluation and click View Reports
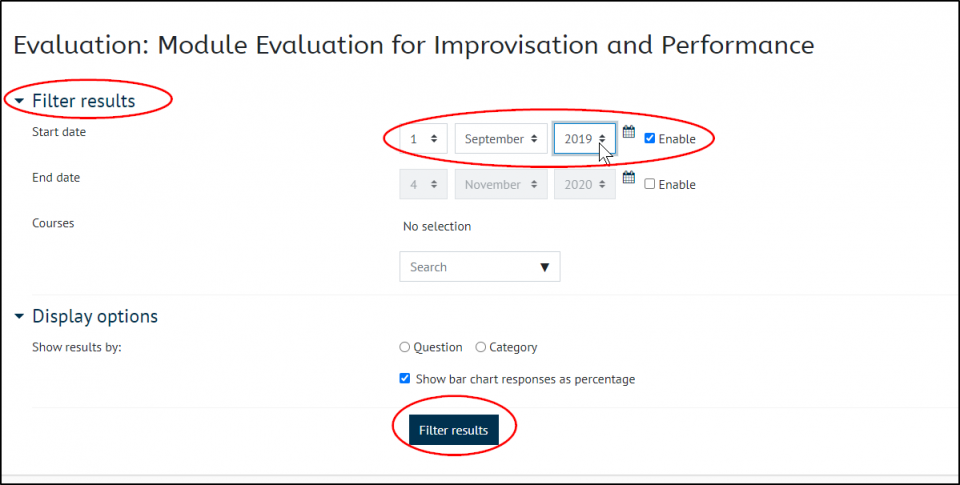
The report dates will always default to the beginning of the current academic year, if you are viewing results from a previous academic year, you will need to change this:
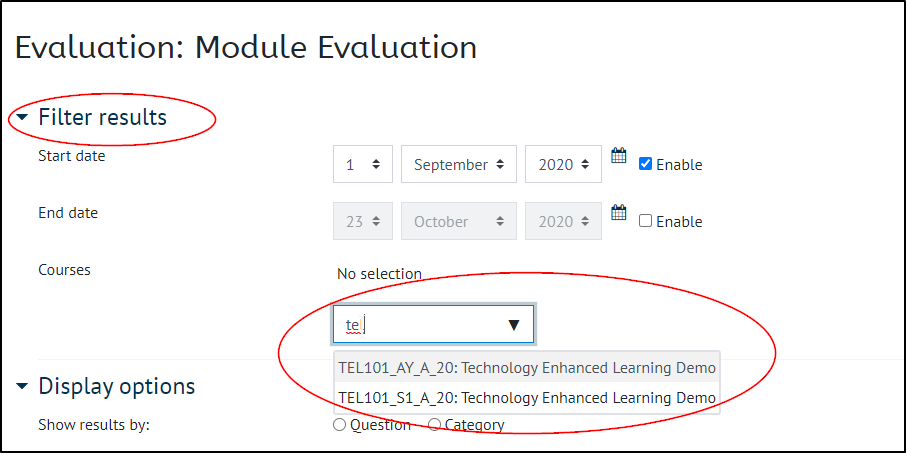
Click on Filter results then either change start date to the beginning of the previous academic year, or you can untick enable to get all results.
You will then see how many evaluations were completed out of how many enrolled users and underneath that:
- a bar chart showing the average response for each question and the most frequent response
- You can hover over each dot on the line to see the actual figure.
- Click Show chart data to see this in a table, this can be copy and pasted into excel
- Underneath this is a Bar chart showing the distribution of responses:
- you can hover over each question bar to see the percentage of responses
- you can click on the items in the legend at the top of the chart to remove them from view if you wish to focus and a particular response:
- Click Show chart data to see this in a table, this can be copy and pasted into excel
- The data is shown is percentages and the corresponding questions are listed underneath.
- underneath this are the free text questions and their answers
- If words are repeated they show in a word cloud, more commonly mentioned words are larger.
Please note: At the moment the reports do not show the total number of respondents per evaluation, this will be collated and emailed out at the end of each semester, if you require this at any other time please email TEL@chi.ac.uk
Administrators Only - merge module results for several modules
All administrators have the option to view several modules at the same time.
This can be done from any results page (there is no central report page for a department or programme)
Open up the Filter results option at the top of the page and type in the code of a module you want to add to these results:
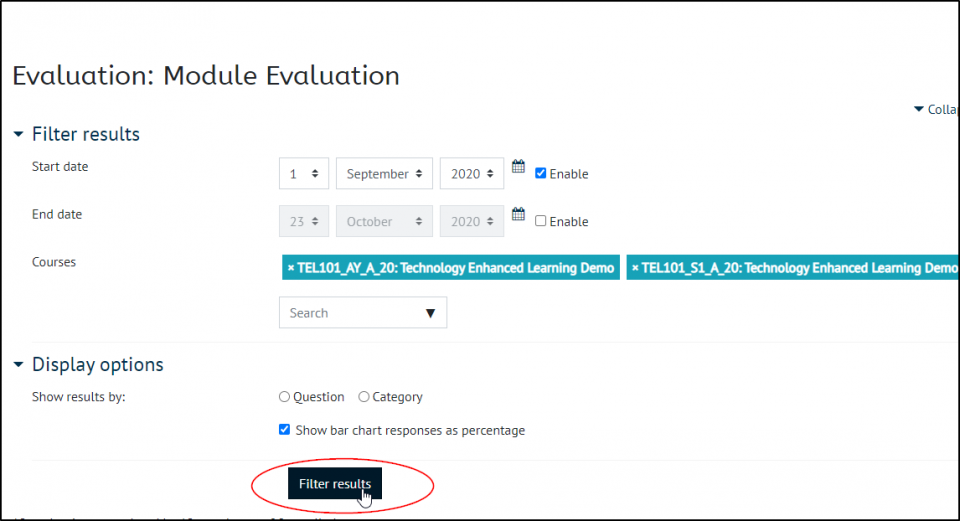
Keep adding modules until you have the set you want to show together. You can only choose modules that are in the same Moodle category.
Once you have added all the modules you want to show together, click filter results


